PREA Quarterly Feature - Spring 2023


Summary
 Kevin Fagan
Moody's Analytics
In the wake of the COVID-19 pandemic, the office sector has faced a deluge of speculation about how the sector will evolve. Headlines have centered mostly on anecdotes, and negative expectations have generally outweighed the negative data. Typical performance measures such as rents, vacancies, and values have shown softness, but broadly speaking, they haven’t revealed a post-pandemic regime shift for the office sector and certainly not a catastrophic collapse compared to past cycles. This leaves thoughtful forecasters of future office performance to adjust their models, mostly using logical constructs rather than empirical evidence.
However, one shift in the data is clearly happening that has forced adjustment and may foreshadow a change in the underlying supply-demand dynamics for the office sector. The historically strong connection between the number of workers in a market and office demand in that market may be decoupling. Total non-farm employment and office-using employment have been powerful macroeconomic inputs into many office forecast models. But employment and office metrics diverged after the pandemic—one of the fastest recoveries of employment in history occurred after the 2020 recession, yet office performance mostly listed sideways.
That trend may stick, and other variables may become more important measures of market vitality and structural utility that translate to office demand, such as industry mix and commute times. Commercial real estate (CRE) econometricians and credit analysts will be kept busy, continuously rethinking office forecasting models in the coming years as the long-term relationship between hybrid working and tenant space demand unfolds.
Moody’s Analytics considers two adjustments relative to employment to be appropriate, both of which reflect the underlying impact of hybrid work. These two adjustments also reflect that the delinking of office performance and employment is likely asymmetric toward the downside. First, the impact of employment growth on office occupancy is lessened. In other words, a strong amount of growth in office-using employment puts less upward pressure on demand for office space and growth in rent and occupancy. This could last for a number of years, at least until the rate of new office supply diminishes to the point that the new demand for space per employee backfills the existing stock of offices. Second, the impact of employment declines on office occupancy is worsened. Economic downturns can cause somewhat deeper downcycles for offices going forward. In normal times, the bulk of firms will hold on to most of their office space, finding that the productivity benefits of hybrid working outweigh the cost savings of dramatically reducing office footprints. However, in an economic downcycle, office tenants are likely looking to save wherever they can, and those that have rolling leases may look to full remote working as a temporary cost-cutting triage.
State of Play for the Office Sector
Overall, traditional performance measures of the current state of the office market reveal general weakness but little about the longer-term future of office performance. Counter to prevailing gloominess about the asset class, office performance metrics bounced back reasonably well after a historically shallow downturn in the 2020 recession.1 If not for the existential questions swirling around the sector, office performance metrics probably wouldn’t be setting off alarm bells about functional obsolescence or a massive shift in how offices are utilized.
Occupancy is very low, but the peak-to-trough change is not abnormal. Rent growth is anemic but positive on a nominal basis and with a wide dispersion across markets. Delinquencies and other signs of loan trouble have ticked up but so far only to a degree that could be seen as noise in normal times and very benign for a downturn. Office values have dipped after a long run of growth, but they haven’t fallen off a cliff. If a secular shift is occurring for the office sector, the typical office metrics aren’t yet reflecting a commensurate secular shift.
Occupancy and Rent
Exhibit 1 shows net absorption, vacancy, and effective rent growth. Net absorption turned negative again at –5.6 million square feet (SF) in 1Q2023, after a –5.0 million to end 2022. The vacancy rate rose to 18.9%, 310 basis points (bps) higher than in the fourth quarter of 2019. Effective rents increased by 0.2% in 1Q2023 compared to the previous quarter. At a level of $28.13 per SF, rents are above their pre-pandemic levels but by only about 0.5%, well below the rate of inflation during that period.
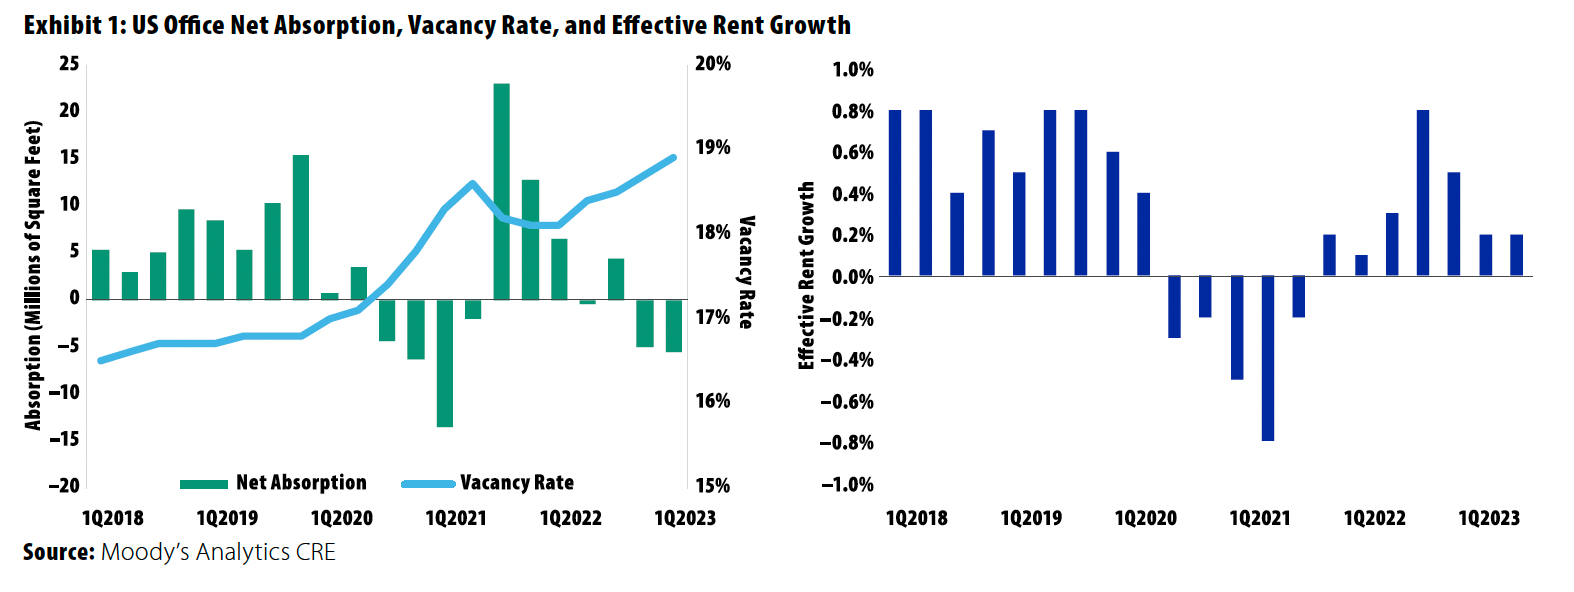
Rent growth remained generally positive throughout late 2021 and most of 2022, and after peaking at 18.6%, the vacancy rate retreated because of steady corporate profits and leasing activity, especially in the Sunbelt.2 The tide is turning after that mild post-COVID recovery, but the current shift is arguably reflective of the softening economy as much as or more than a fundamental shift in the office sector.
The macroeconomic slowdown has led to increases in job cuts, and some corporate tenants have paused expansion plans.3 Therefore, not surprisingly, as leases continue to expire at a pace of about 10% of leased office space per year, two consecutive quarters of negative net absorption and softening of rent growth have resulted.4
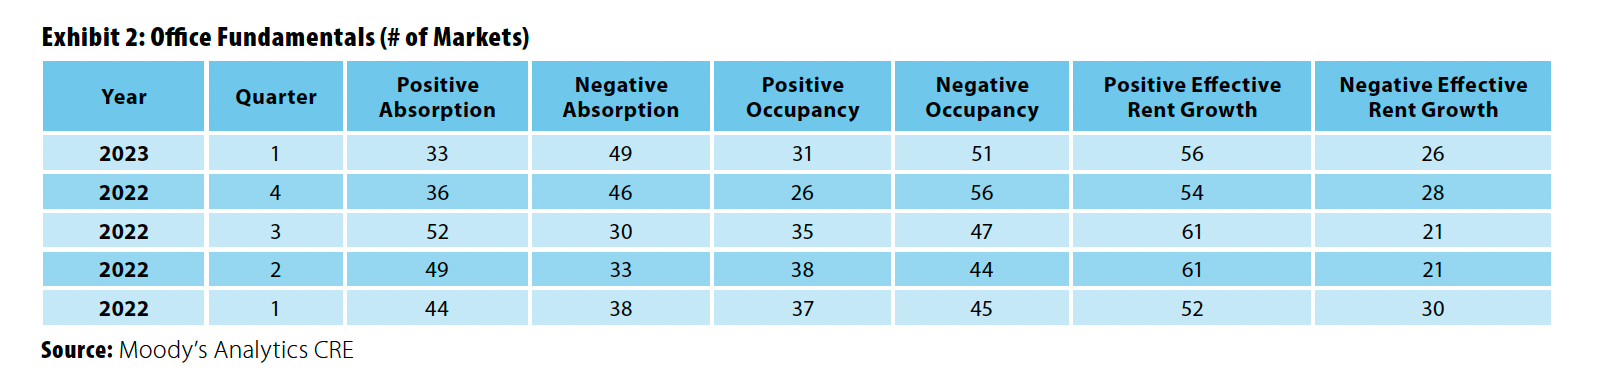
To muddle matters further, Exhibit 2 shows the wide dispersion of office performance across markets, where many office markets have performed quite well post-pandemic, in line with a normal recovery period. This dispersion complicates modeling a universal pullback in office performance.
Values and Returns
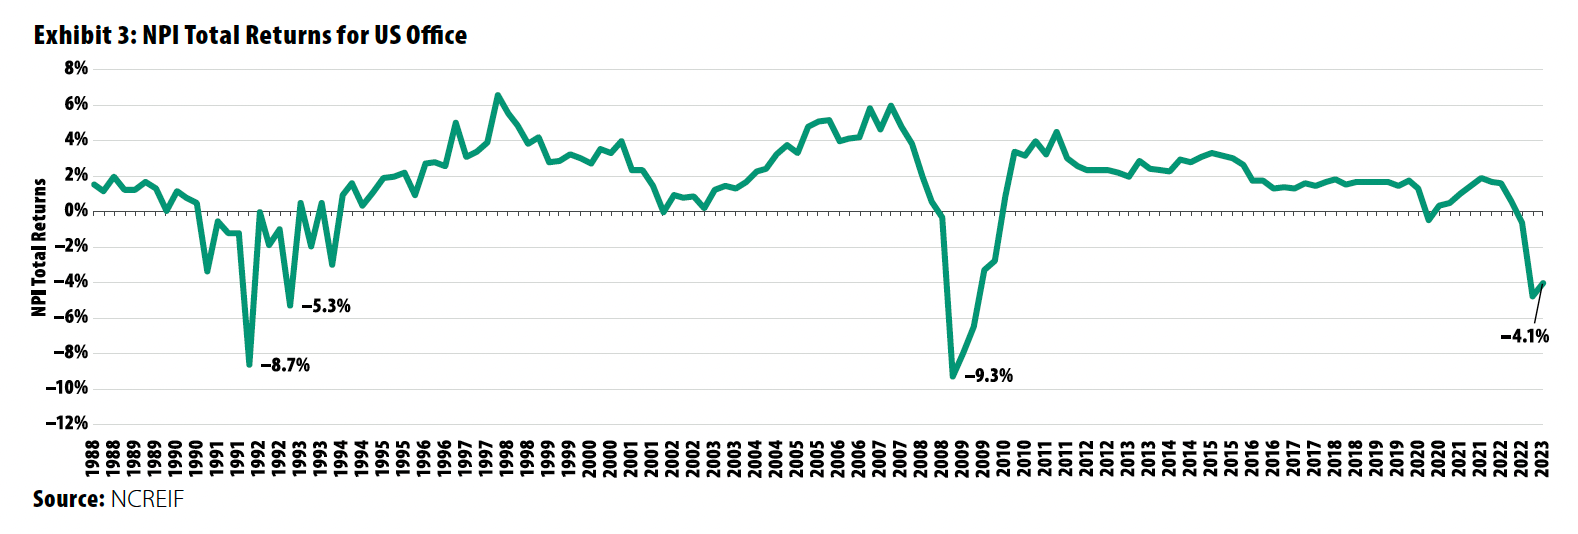
A downward shift in values and capital returns on office properties has occurred in recent months, but so far, those declines don’t reveal a shift that’s abnormal for an economic downcycle. Exhibit 3 shows the NCREIF Property Index (NPI) total returns for office going back to 1988. The recent quarters of office returns were significantly negative (as they were for multifamily, industrial, and retail), driven by markdown in valuations and rising rates.
Although headlines have noted every basis point increase in delinquency rates and the moderate increase in rates of workouts, extensions, and office loans going into special servicing, the data do not yet show anything abnormal historically and provide clues about the future of office performance. But the loan maturities scheduled over the next two years may start to provide clues about what types of offices and office markets will face greater challenges.
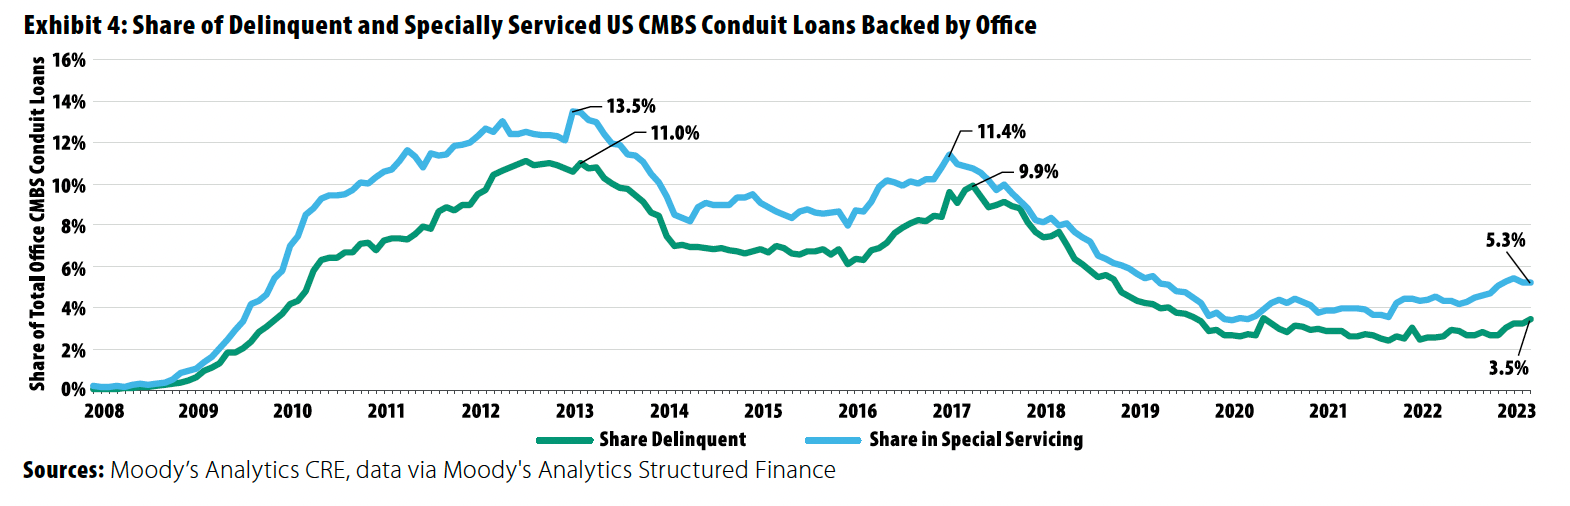
Exhibit 4 shows the delinquency and special servicing rates for commercial mortgage-backed securities (CMBS) conduit loans backed by office properties. The rate crept up to 3.24% as of March 2023. Like other measures, this rate is benign historically. But the share of loans in special servicing did creep up to 5% in April, and the number of maturity defaults and office loan workouts is increasing.
The majority of the upcoming 2023 $728 billion in CRE mortgage maturities will face challenges for refinancing, requiring extensions, workouts, or new equity to avoid default and foreclosures. For example, $19.7 billion of CMBS office loans maturing before 2025 may experience refinancing challenges.5 However, a majority of maturing office loans over the past year successfully refinanced, and very few were liquidated at a loss. Monitoring trends in office loan maturities over the next two years will likely provide important indications about the resiliency or vulnerability of the office sector.6 But so far, that picture remains unclear for office forecasters based on loan performance data.
Other Metrics
A number of other metrics have arisen as potential indicators of future office performance, such as subleasing, office worker utilization rates, REIT valuations, and commute times. However, for office forecasters, these measures are not yet established as fundamental inputs to models. There isn’t a long enough history, and the variables don’t yet show an overwhelming indication of performance holding all else equal.
However, one traditional macroeconomic input, employment, offers some guidance.
The Delinking of Employment and Office Metrics And the Future of Office
Since the pandemic, employment levels among office-using industries and office market performance started to move in different directions, offering clues for forecasters about the future of office. Companies have done substantial hiring during the recovery—the total number of US non-farm employees surpassed the pre-pandemic peak as of the summer of 2022. But office performance has lagged, as many firms have paused office expansion plans while their employees continue to work remotely.
Many firms just aren’t clear on what their space needs will be going forward, and they’re searching for the “efficient horizon” of space needs. Nearly all employers see great benefits from both remote work and in-person work in a centralized office. Firms will have to first find a balance between the two, functionally maximizing the benefits of both. Meanwhile, real estate is a relatively small cost to firms as a share of their revenue (real estate costs average about 4% of professional service company revenue and less than 1% for many large tech firms), so the value of that savings comes second to getting their talent management right. That balancing act will likely be a trial-and-error process, with evolving approaches over the next few years. For example, what does new common collaboration space look like, and how much of it is needed? Do employees need on-site storage space? How should intellectual property and private documents be protected? How many private offices can be eliminated? Which employees work better remotely, and which are needed on site for impromptu collaborations? How much space is needed for hoteling desks? How many hoteling desks are needed per hybrid employee? What is the minimum number of days in the office for mentorship, succession planning, and aggregate productivity? How much will satellite offices or coworking spaces supplant centralized offices?
Before those questions are answered, most tenants won’t head for the exits, nor will they make unnecessary office commitments. After the transition phase, tenants will adjust their office space needs with more confidence. In the meantime, employment numbers relative to office metrics provide hints at how to adjust office forecasting.
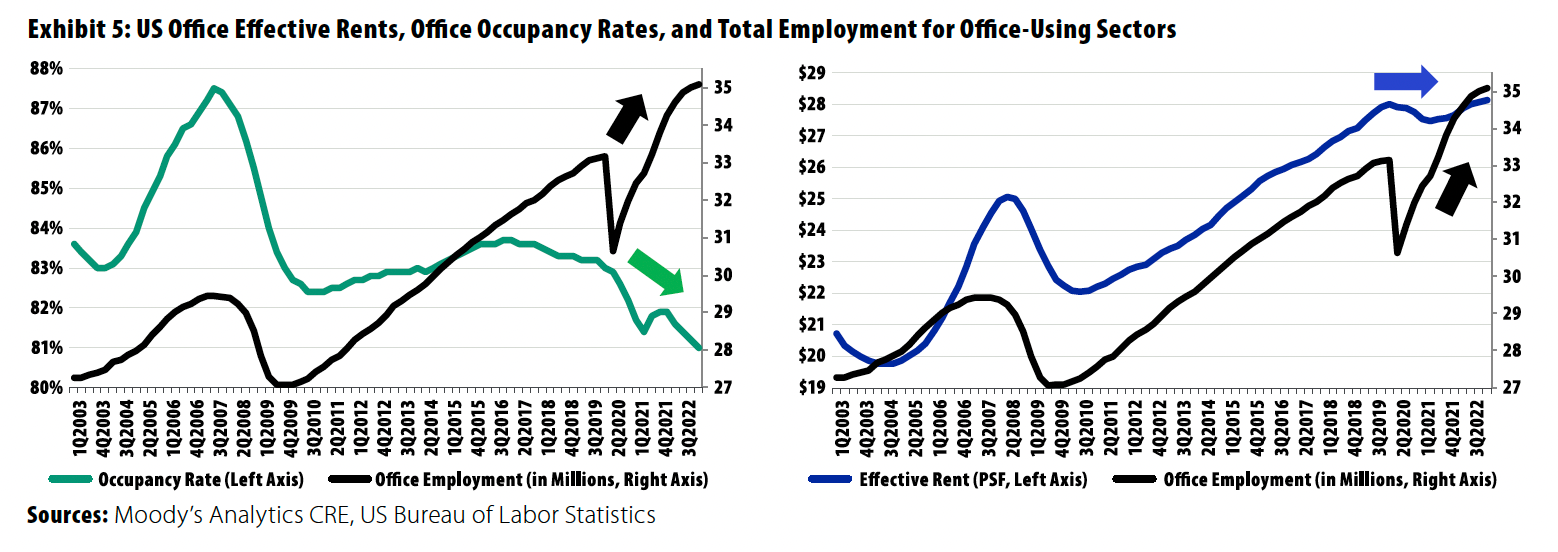
Exhibit 5 illustrates this with historical US office rents, occupancy rates, and the total number of office-using employees between 2003 and 2020. Since Moody’s Analytics CRE (formerly REIS) started tracking office statistics in the late 1980s, office-using employment has served as one of the reliable leading indicators of office rent and occupancy, which makes sense. Basically, more bodies working at desks generally means more need for office space. That was true even during the 1990s, when office layouts changed to open floor plans, and the office space leased per employee was slashed by roughly half between 1990 and 2000. Even then, office-using employment grew faster than office inventory, and rents and occupancy rates moved directionally with employment. However, since 2020, office-using employment has jumped considerably, while office fundamentals have lagged.
Exhibit 5 shows that almost immediately after the dramatic loss of employment in mid-2020, employment for office-using industries started to recover. By the end of 2021, employment had fully rebounded and exceeded the pre-pandemic level. However, the office sector’s post-pandemic road to recovery has been bumpy. As of 3Q2022, effective rents were only $27.99 per SF—still lower than the pre-pandemic level of $28.02 in 1Q2020. Given the skyrocketing inflation rate (12.30% from 1Q2021 to 3Q2022), the inflation-adjusted office rents have decreased 11% since 1Q2021, and the employment for office-using industries increased by 4.0% during the same period.
Occupancy rate trends show similar patterns. The second chart in Exhibit 5 reveals that office-using employment and occupancy rates mostly followed the same direction before the pandemic. Then they both experienced a sharp decline in 2020. Office occupancy rates showed some improvement in 3Q2021, increasing 40 bps from the previous quarter, reaching 81.8%. Directionally, this moved with the economic recovery but barely. And when the economy began to slow roughly a year ago, occupancy rates diminished very quickly.
This has led to two potential tweaks to office forecasting to reflect a regime shift for the sector: employment matters less to the upside and more to the downside.
Employment Matters Less to the Upside
At least in the near term, office-using employment growth will be less correlated with increasing occupancy. Adjusting Moody’s Analytics’ forecasts to account for this indicates a less-rosy baseline forecast, as shown in Exhibit 6. On average, this results in office occupancy rates roughly 70 bps lower in Moody’s Analytics’ five-year forecast.
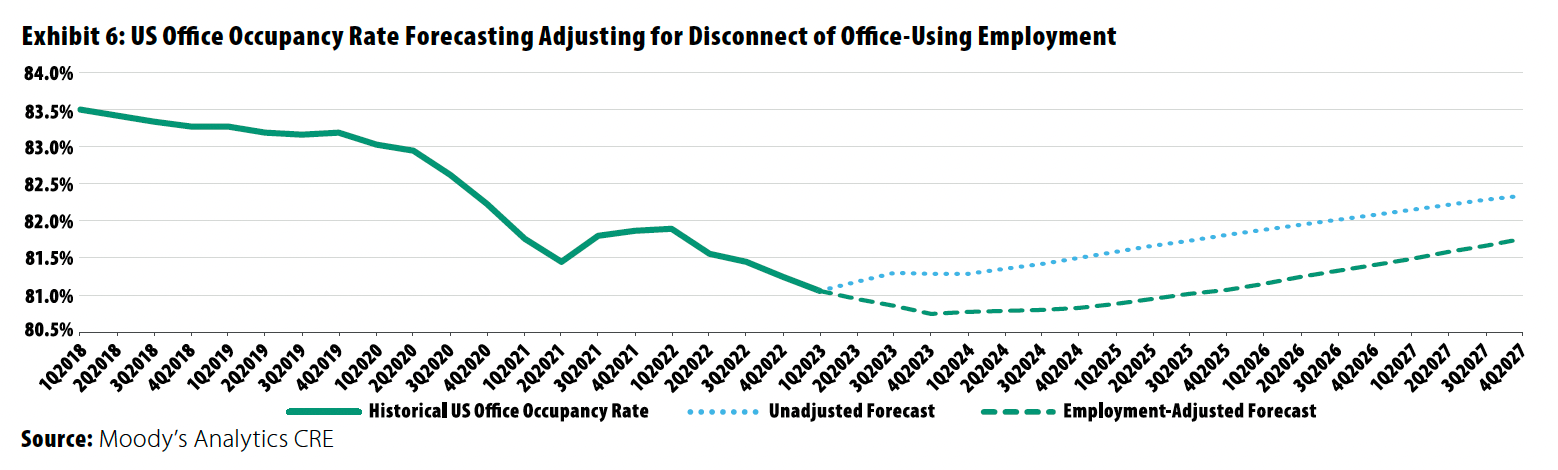
Moody’s Analytics ultimately expects that office construction will slow dramatically in the coming years, and economic expansion and office-using employment growth will backfill vacant office space. The 1990s offer a potential corollary. Again, the demand for office space per employee was slashed because of open floor plans, and in addition there was a glut of 1980s’ supply to work through. Yet office rents and occupancies did recover from the all-time lows in the early 1990s as the US economy shifted from a manufacturing to a services-type economy. That trend continues now in the 2020s and will likely offer support to the office sector by the middle of the decade.
Going forward, office utilization rates by workers is likely to peak at around 60% of 2019 rates, reflecting on average about two days less in the office. Because tenants will be unable or unwilling to shed 40% of their current space to match utilization rates, the overall net decline in demand is likely to be between 0% and 40%, not counting broad economic expansion. Because of the need for more community space, overlapping days in the office among teams on anchor days, and allowance for future growth, on average, corporate tenants will likely be able to non-disruptively shed between 10% and 15% of space. Again, this is significantly less than the decline in space demand per employee in the 1990s.
Employment Matters More to the Downside
Employment numbers also reveal that weakening jobs numbers can more quickly lead to a decline in office occupancy rate. This is reflected in the recent numbers for office, and assuming this is structurally the case is reasonable. In downturns post-2020, struggling tenants with expiring leases can take the option to go temporarily remote as a triage measure to cut costs and survive, while in normal times, in-person or hybrid work arrangements are likely the most effective workforce situations. It’s very possible that space needs in a downturn dip much more than the 10% to 15% mentioned earlier.
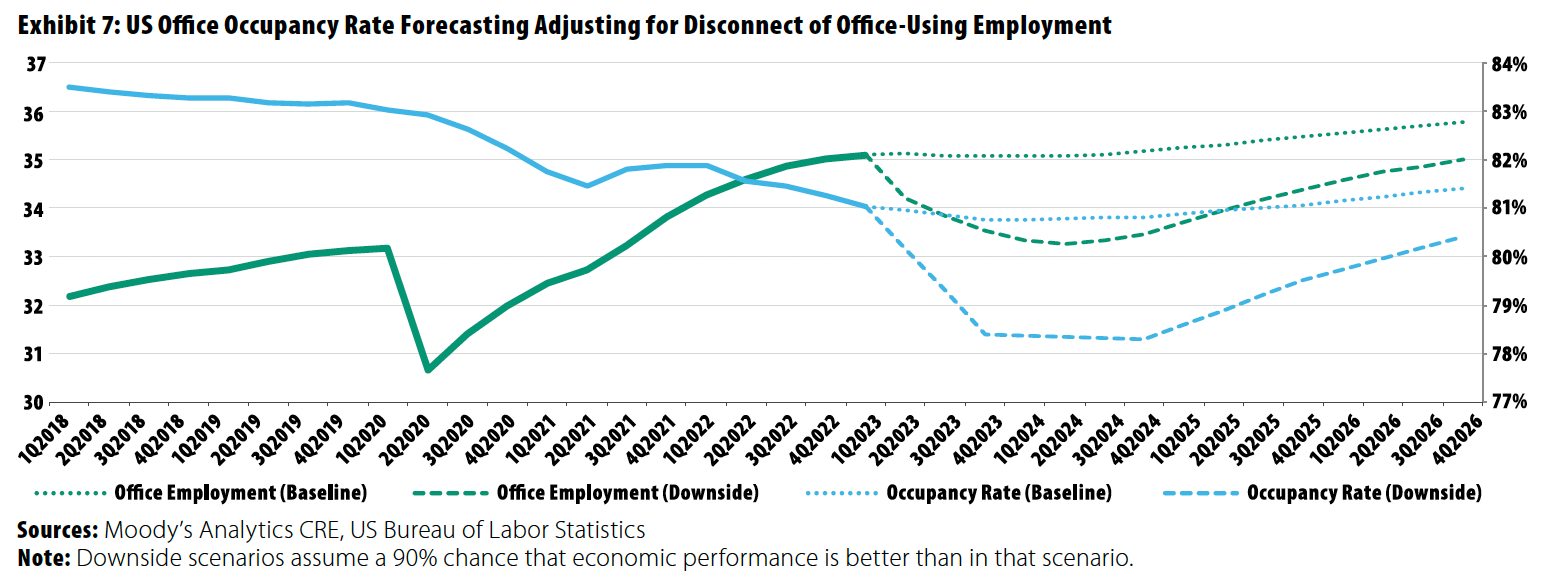
Exhibit 7 compares the baseline to downside forecast scenarios for both office-using employment and office occupancy rates. The office occupancy rates are very reactive to loss of office-using employment; the decline of occupancy rates at the late-2024 trough is roughly 2.5% lower than the baseline occupancy forecast. A vacancy rate of almost 22% in a downside scenario would be the highest in recorded history. 
1. Kevin Fagan, et al., “Compared to Past Cycles, How Bad Has the Pandemic Been for Offices?” Moody’s Analytics, June 13, 2022.
2. Kevin Fagan, “Corporate Defaults Signal Cautious Optimism for the Office Sector,” Moody’s Analytics, Feb. 7, 2022.
3. Dante DeAntonio, et al., “Daily Economic Roundup—March US Jobs Report Final Thoughts,” Moody’s Analytics, April 6, 2023.
4. Kevin Fagan, et al., “The Future of Office Will Be an Odyssey not Exodus, With Uneven Credit Implications,” Moody’s Investors Service, July 9, 2020.
5. Darrell Wheeler, et, al., “Work-from-Home Is Decreasing Office Occupancy and Increasing Refinance Risk,” Moody’s Investors Service, March 20, 2023.
6. Matt Reidy, Varun Koundinya, and Kevin Fagan, “Office Maturity Monitor: 6 Things You Need to Know from April,” Moody’s Analytics CRE, May 11, 2023.
Kevin Fagan is a Senior Director and Head of CRE Economic Analysis at Moody’s Analytics.
This article has been prepared solely for informational purposes and is not to be construed as investment advice or an offer or a solicitation for the purchase or sale of any financial instrument, property, or investment. It is not intended to provide, and should not be relied on for, tax, legal, or accounting advice. The information contained herein reflects the views of the author(s) at the time the article was prepared and will not be updated or otherwise revised to reflect information that subsequently becomes available or circumstances existing or changes occurring after the date the article was prepared.