PREA Quarterly Feature - Summer 2023


 Alex Symes
BlackRock
 Yasmine Kamaruddin
BlackRock
Reports of the “urban doom loop”—the possibility that declining urban tax bases since the COVID-19 shutdown could result in the demise of some cities—first appeared in popular media in 2021 and is now a go-to trope on slow news days. The fear may not be completely unfounded. The 40-year acceleration1 of remote work triggered a rethinking of how people live, work, and play in a post-pandemic world, and this has implications for local tax revenue. That said, the urban doom loop is more likely clickbait rather than a mega trend. We believe much of the doom and gloom is likely overblown; most large cities have diversified revenue streams. At the same time, there may be exceptions that warrant the attention of investors.
What Creates the Doom Loop?
The urban doom loop implies that the rise in remote work leads to higher levels of commercial real estate vacancy, which in turn leads to lower office valuations and declines in property tax collections. This in turn leads cities to cut city services, which pushes businesses and residents to leave the city. The decline in companies and residents subsequently creates more vacancy, thus leading to a chain reaction of declining valuations, lower property taxes, and service cuts, exacerbating the exodus of potential tenants.2 Returning to reality, the risk of an urban doom loop is likely overblown, but real estate investors should still be concerned about the prospects of rising property taxes and/or some cuts to city services.
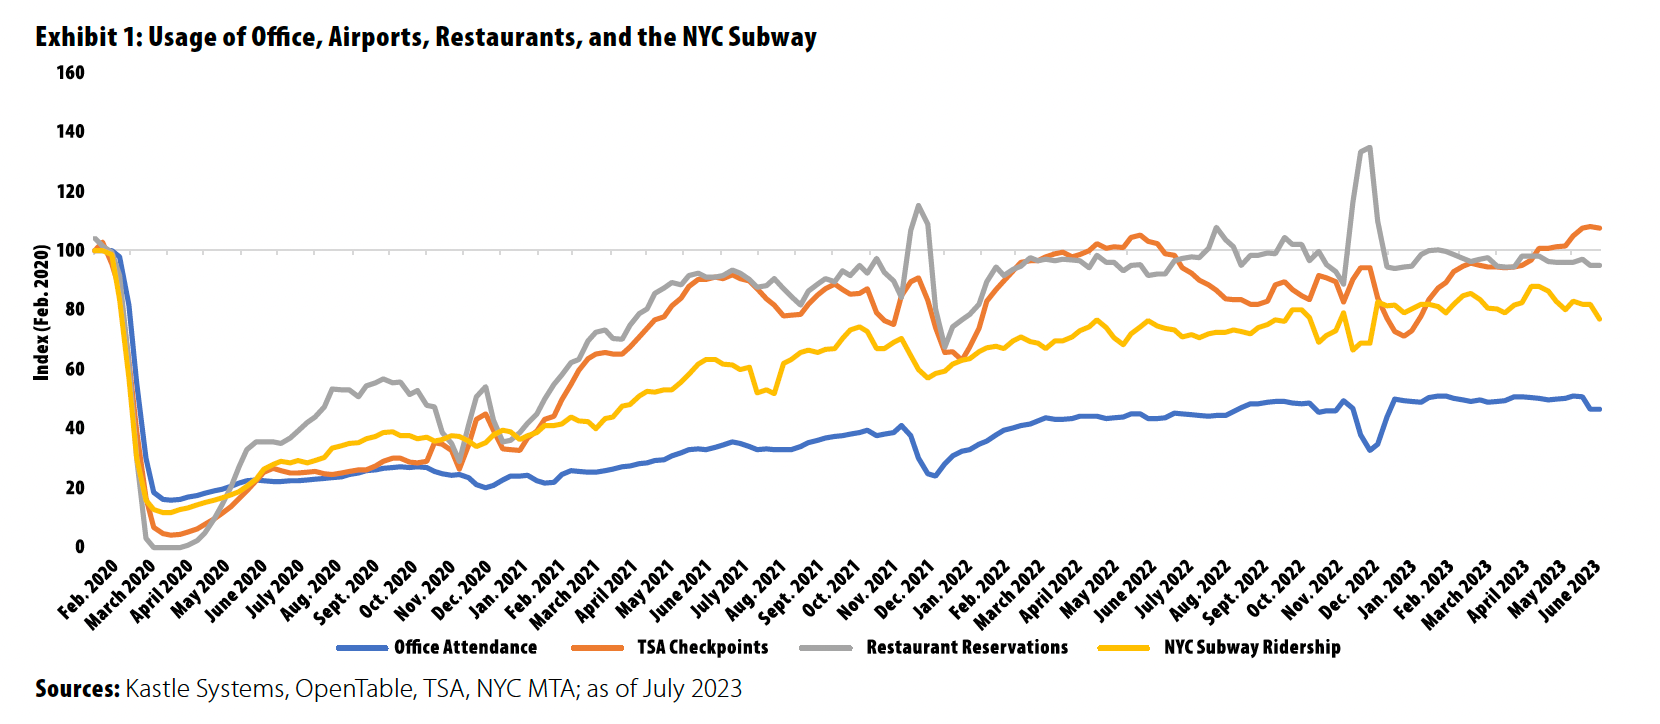
Although a full-scale doom loop is unlikely, given that companies seem to be arriving at a floor for office attendance, office values have to adjust to the new reality, especially given current illiquidity because of tighter credit and high interest rates. Physical occupancy of offices has recovered drastically from the low levels observed during the shutdown but not as much as restaurant reservations and TSA checkpoint counts (Exhibit 1). A recent paper suggested that in New York City alone, office value destruction could total $453 billion and that values could remain around 45% below prepandemic levels in the long run.3
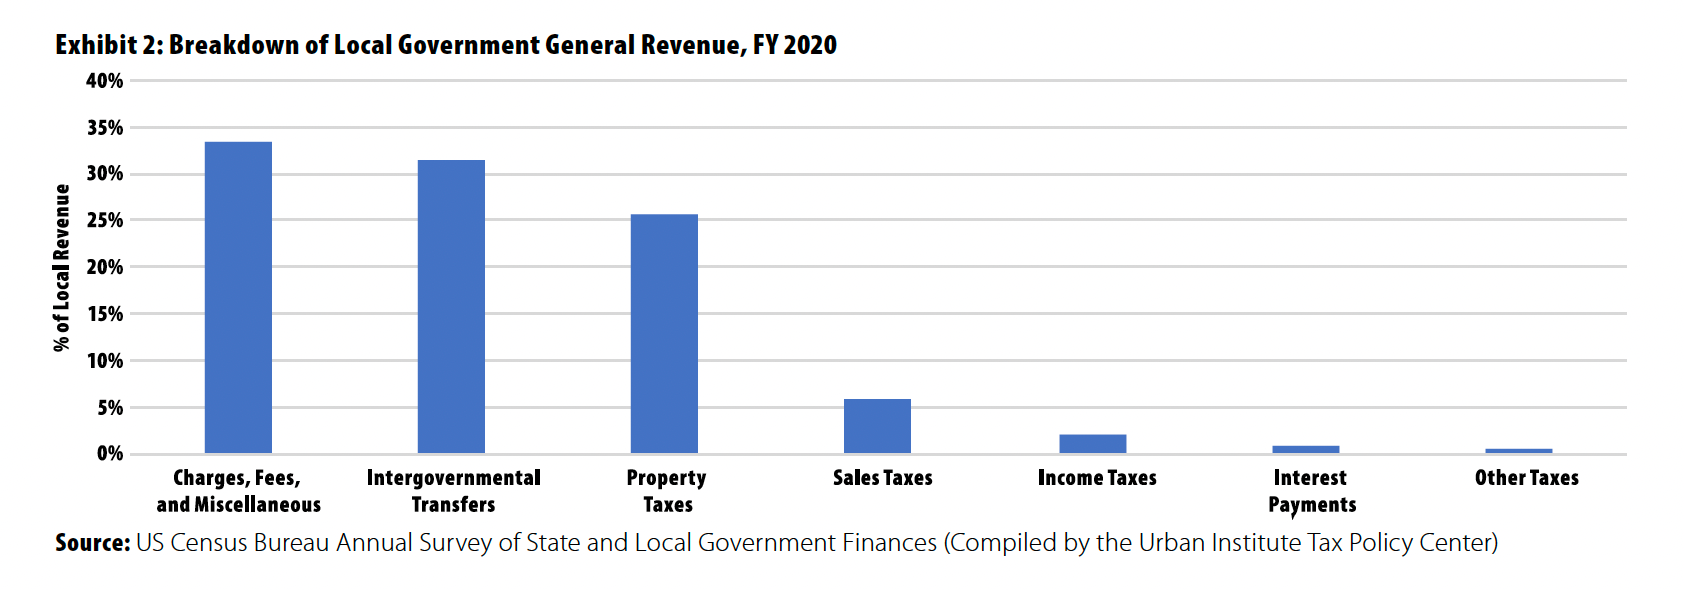
At the same time, the actual effects on city budgets are likely exaggerated for several reasons. First, office property taxes constitute a small percentage of tax revenues, and assessed values are generally lower than fair value. In addition, local governments are supported by diverse tax sources, not all of which are likely to soften at the exact same time, so cities have a variety of options to balance their budgets. The current health of retail spending, tourism, and for-sale housing should provide support of the tax base through sales tax, property tax, fees and charges (e.g., sewer and parking fees), income tax, and more (Exhibit 2). Cities also generate revenue through federal and state transfers, and most cities have reserves available at the state level, which prevented overborrowing in recent years.
On the other side of the balance sheet, cities have several tools in their arsenal to balance budgets. Examples include reducing certain services or increasing alternative sources of revenue. Trimming services such as prekindergarten or public library budgets may be a risk for keeping residents but can also be a temporary and necessary fix to a budget issue. That said, real estate investors should keep in mind some rising budget pressures. Post-pandemic salaries for essential workers such as teachers, police, and firefighters are increasing, and cities have little flexibility around these services.
Although fiscal risks are on the horizon for governments, most state budget reserves are healthy. State and local tax receipts have been largely stable since the pandemic began, and rainy-day funds reached a record $134.5 billion as they entered fiscal year 2023.4 Tax collections declined slightly—3.5%—year-over-year in 1Q2023, driven by a drop in individual and corporate income taxes by 17% each.5 Part of the reason for the decline in income taxes is the weaker financial markets, which resulted in lower capital gains taxes. Property tax receipts, however, increased by 5.7% year-over-year in 1Q2023,6 likely driven by increases in house prices and appreciation in commercial real estate such as apartments and warehouses. Indeed, house prices have increased 41% from Feb. 2020 through April 2023.7 Assessed values generally lag the home transaction market; therefore, gains in home prices over the past three years still have room to run.
Property tax revenue may decline or grow more slowly over the next few years if commercial property values take a hit from rising vacancies, but the risk to city budgets is low to moderate. The property type most at risk for steep declines in valuations is office, which is only a small portion of the base. Even in New York City, the largest institutional office market, office property taxes make up 21% of the total property tax levy, which equates to roughly 10% of total taxes.8 A recent report by the NYC comptroller highlighted that under a “doomsday” scenario, in which office property valuations decline 40% in total from 2023 to 2029, total New York City property tax receipts will still grow through 2027. However, relative to the baseline scenario, the gap is expected to be $322.7 million in fiscal year 2025 and expand to $1.12 billion by 2027.9 This makes sense; assessed values are based on the prior fiscal year’s net operating income rather than on forward-looking valuations. Office leases tend to be long term; according to data from CompStak, office lease terms have averaged five years since 2013. Therefore, any declines in net operating income because of an increase in vacancy will take some time to phase in. For example, although Manhattan office values declined by 20% since the recent peak in 2Q2021,10 assessed values of Class Four properties, which includes offices, retail, and other commercial types, increased by 4.7% from fiscal years 2022–2023 to 2023–2024.11 There is downside risk to this forecast in that office values may fall further than expected. Some of the office debt maturities in the US, which totaled $306 billion during 2023 and 2024,12 may not be extended or refinanced and therefore may become distressed, potentially putting greater than expected stress on office values.
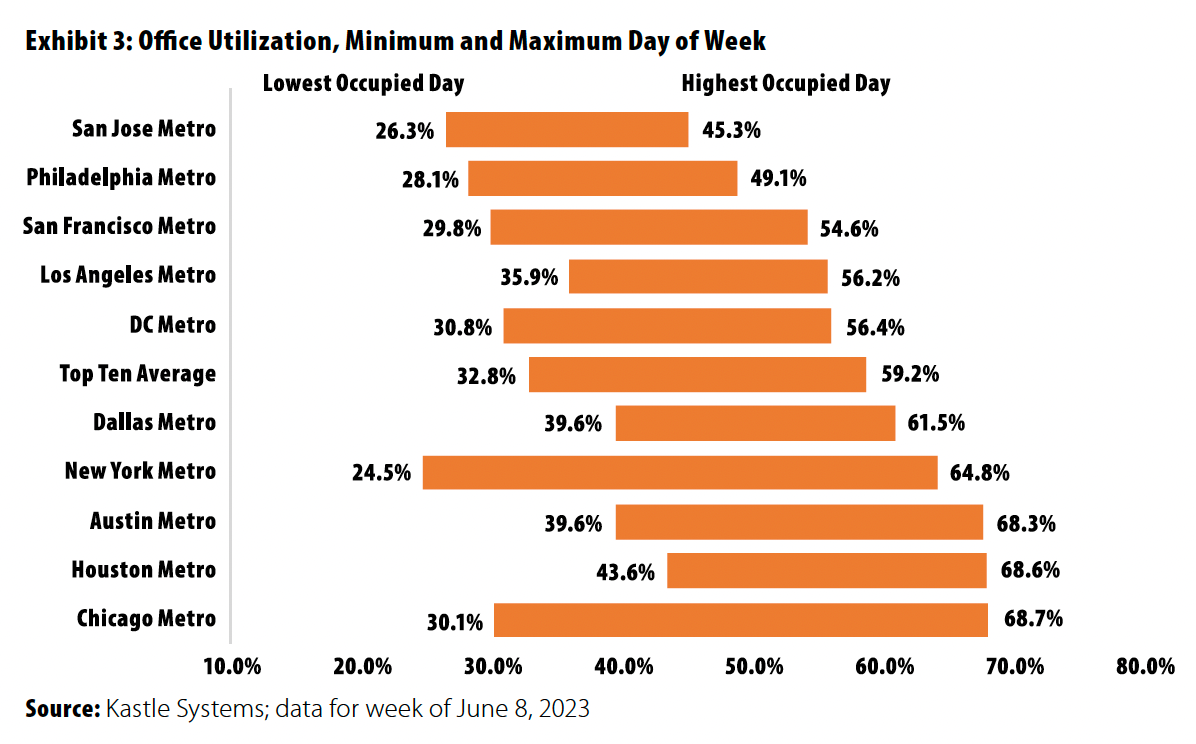
At the same time, there are signs that the office market is stabilizing. Many companies in finance, technology, and other professional services have started to mandate at least a partial return to office (e.g., three to five days per week) to improve company culture and increase productivity. However, these mandates are not all-encompassing and reflect a mostly hybrid work arrangement. Many activity indicators, such as commute times, Kastle office utilization data,13 and mass transit volumes, have meaningfully recovered but remain below pre-pandemic levels (Exhibit 3). Overall economic activity is normalizing, as can be seen with airport and toll system volumes, which are back to 2019 levels, just not for office.
Although airport and toll system volumes have returned to near pre-pandemic levels, mass transit systems have yet to have the same level of recovery, and this is a risk for city budgets. Several large mass transit systems confront operational challenges because ridership recovery from pandemic troughs has been slower. Low ridership, escalating capital needs, and the drawdown of federal COVID-19 relief funds are significant headwinds for several high-profile issuers. In June 2023, S&P Global Ratings downgraded San Francisco’s Bay Area Rapid Transit District from AA to A+. If fare-box revenues continue to stagnate, state and local governments will need to provide alternative revenue sources to bolster these essential infrastructure assets, such as the payroll mobility tax rate increase New York passed in its fiscal year 2024 budget, generating an additional $1.1 billion annually for the Metropolitan Transportation Authority.14 This itself may contribute to lower demand for city-center office.
How Does This Affect Investments?
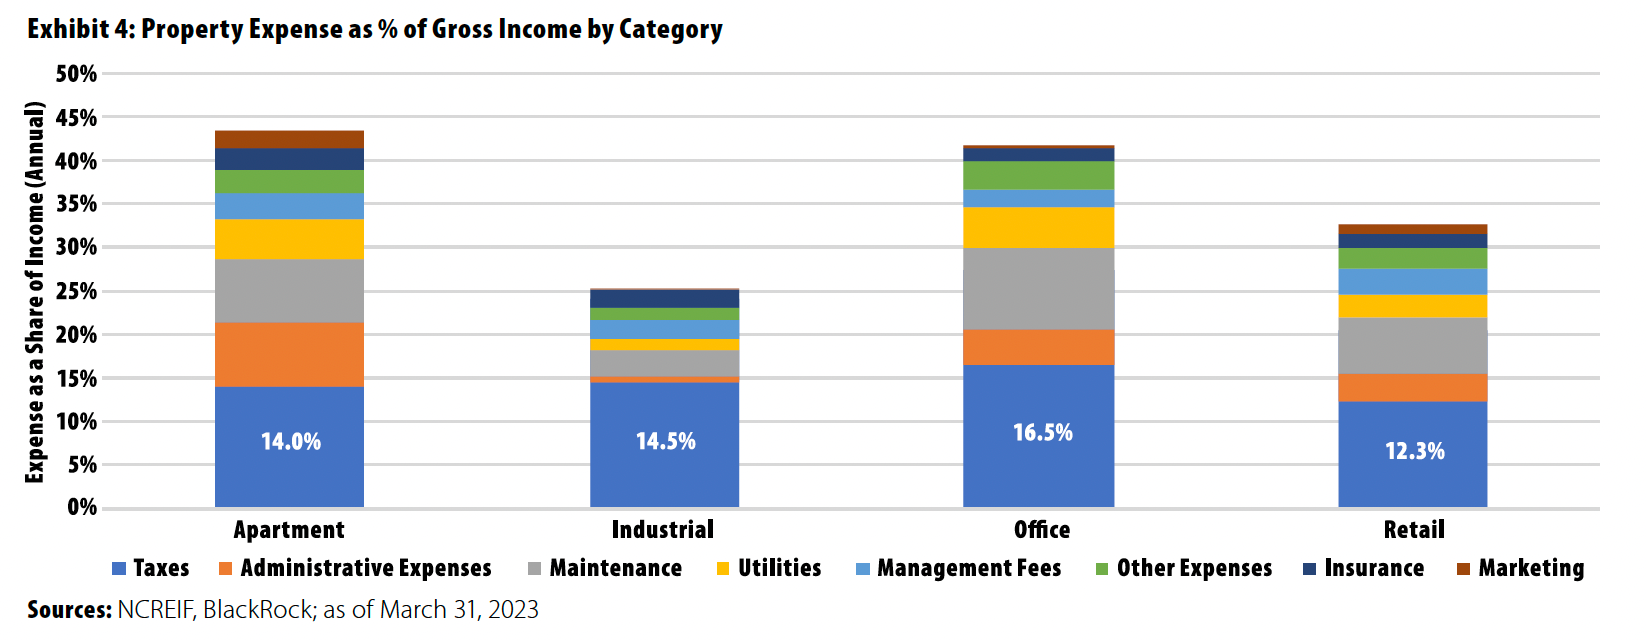
Rising taxes will likely hit property values over the next few years. Taxes are generally the largest expense item on the income statement of a typical commercial real estate asset, so increases in the mill rate could hit prospective returns. Over the past year, taxes have constituted between 12% and 17% of gross operating income, depending on the property type and location. Over the long term, investors generally expect returns of 6% to 8% annually from unleveraged, stabilized real estate. We estimate that an increase in property taxes of 10% to 40% could decrease ten-year total returns by 50 to 150 basis points. Further, transfer taxes are becoming increasingly popular. Fourteen have been implemented in California alone15 since 2018. Transfer taxes increase the friction costs for transacting and therefore will likely lower deal activity. This will potentially reduce the amount of capital willing to buy in higher-transfer-tax municipalities.
—Mark Twain
Rising taxes may hasten the move out of some of the more heavily tax-burdened metros, such as Chicago; San Francisco; Washington, DC; and to some respect, New York City and Los Angeles. The pandemic caused an acceleration of out-migration from large metros and toward the South and smaller markets in the West. There has been some reversal back to pre-pandemic trends as employees and residents move back to large metros, driven by job growth, but the growth in the South and secondary western markets will likely persist for some time. In June, Oxford Economics forecast that immigration is set to bounce back from steep declines during 2020 and 2021 of -75% for the nation. New York and Los Angeles typically absorb as much as 11% and 5%, respectively, of annual international immigration into the US. Immigration returned to 1 million in 2022 from a low of 350,000 annually during the pandemic.16
Although the doom loop scenario is unlikely in general, a select number of cities are more at risk because of greater-than-average deterioration of office fundamentals. San Francisco and Washington, DC, are the two markets that are likely at greatest risk. Residents and workers have returned at a much slower rate to both cities, and office utilization rates remain depressed. Office space in both cities is largely concentrated in the central business districts or urban areas, and many office workers commute. As a result, neither San Francisco nor Washington, DC, has benefited from the rise in residential house prices over the past couple of years, as other major US metros have. Commercial real estate investments in both cities will likely be more at risk of rising taxes, especially relative to rents, than properties in other larger metros.
Student housing should also be monitored. Some smaller municipalities supported by universities or colleges are at risk because of slowing or declining student enrollment. This is especially acute in the Northeast and Midwest, but lower enrollment is a national phenomenon.17
Cities are acknowledging that office vacancy is an issue that will persist if nothing is done. Many are clearing the path for rezoning and even developing public-private partnerships to repurpose the built environment to revitalize the neighborhoods. Chicago, for example, has moved forward with redevelopment of LaSalle Street within the Loop, utilizing tax increment financing and other incentives to help move projects forward. These types of plans can attract attention from businesses; case in point, Google recently entered a build-to-suit agreement within the LaSalle Street corridor.
Conclusion
Investors will likely benefit from sticking to long-term structural trends instead of focusing on fears that might not materialize. We believe the urban doom loop scenario is likely overblown and that ultimately real estate fundamentals and values will benefit from being on the right side of major structural shifts. We see three main investment themes for the next ten years: aging demographics, modernization of the built environment, and reshoring and rewiring of supply chains. Different markets have varied alignments to these themes, which is something investors should pay attention to when thinking of market selection. 
1. Jose Maria Barrero, Nicholas Bloom, and Steven J. Davis, “Why Working from Home Will Stick,” National Bureau of Economic Research, working paper 28731, June 5, 2023.
2. Philip Pilkington, “Work from Home and Empty Offices Leading to ‘Doom Loop’ for NYC,” New York Post, June 8, 2023.
3. Arpit Gupta, Vrinda Mittal, and Stijn Van Nieuwerburgh, “Work from Home and the Office Real Estate Apocalypse,” SSRN, May 15, 2023.
4. Justin Theal and Alexandre Fall, “Record State Budget Reserves Buffer Against Mounting Fiscal Threats,” Pew Charitable Trusts, March 16, 2023.
5. Quarterly Summary of State and Local Government Tax Revenue, US Census Bureau; as of March 2023.
7. S&P/Case-Shiller U.S. National Home Price Index; as of April 2023.
8. Brad Lander, NYC Comptroller, “Spotlight: What Risks Does the Office Market Pose for the City’s Finances?” New York City Comptroller, June 13, 2023.
10. Real Capital Analytics; as of March 2023.
11. "2023/24 Final Assessment Roll,” NYC Department of Finance, May 25, 2023.
12. Mortgage Bankers Association, Moody’s Analytics, and BlackRock; as of Dec. 31, 2022.
13. Kastle Systems office utilization data measures physical occupancy at office buildings with Kastle access systems compared to utilization on March 4, 2020.
14. New York State Comptroller Enacted Budget Report, State Fiscal Year 2023-2024, as of May 2023.
15. Craig A. Becker, et al., "Recent Measures Establish Tax Increases on Real Property in CA,” Pillsbury Alert.
16. Oxford Economics; as of June 2023.
17. Katherine Meyer, “The Case for College: Promising Solutions to Reverse College Enrollment Declines,” Brookings Institution, June 29, 2023.
Alex Symes is a Director and Head of US Research and Strategy and Yasmine Kamaruddin is a Director of US Research and Strategy at BlackRock.
This material is intended for information purposes only, and does not constitute investment advice, a recommendation or an offer or solicitation to purchase or sell any securities to any person in any jurisdiction in which an offer, solicitation, purchase or sale would be unlawful under the securities laws of such jurisdiction. This material may contain estimates and forward-looking statements, which may include forecasts and do not represent a guarantee of future performance. This information is not intended to be complete or exhaustive and no representations or warranties, either express or implied, are made regarding the accuracy or completeness of the information contained herein. The opinions expressed are as of July 21, 2023, and are subject to change without notice. Reliance upon information in this material is at the sole discretion of the reader.